UCCE’s South Sacramento Valley orchard ET report for October 30 through November 6 provides weather-based water-use estimates for four station locations, but those estimates are not a direct irrigation prescription. Rainfall, stored soil moisture, orchard-floor vegetation and irrigation-system performance all affect how much water an orchard needs from irrigation.
The report covers CIMIS stations at Woodland, Davis, Staten Island and Verona. Although published November 13, its reporting period ends November 6. For growers using the reports to guide water management, the distinction matters: the period being measured, rather than the posting date, defines which conditions the estimates describe.
An explanatory UCCE guide updated in April 2021 describes the reporting approach developed with the California Department of Water Resources’ Northern Region. It separates estimates based on measured weather from historical averages and explains how to connect crop water use with soil water supplies and irrigation-system capacity.
Measured weather is not a forecast
Under that guidance, past-week and cumulative seasonal crop ET estimates use measured weather conditions. The next-week estimate, however, uses a historical average, not a short-term weather forecast. Those figures therefore answer different questions: one estimates water use under weather already recorded, while the other describes an average rather than a forecast of the coming week.
The crop assumptions also deserve attention. UCCE bases its estimates on healthy crops with enough soil moisture to avoid growth limitations. For bearing orchards, the reference is trees in their fifth leaf or older. Younger, nonbearing orchards require adjustments, so the bearing-orchard estimate should not be treated as a direct match for every planting.
Match the orchard-floor assumptions
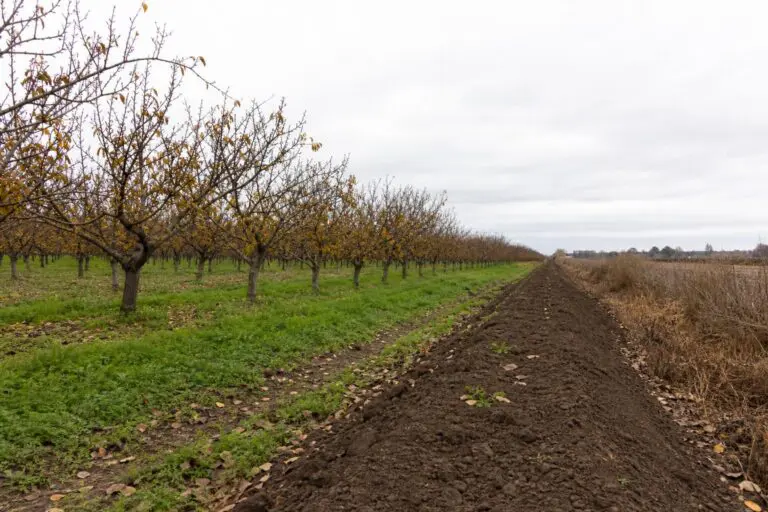
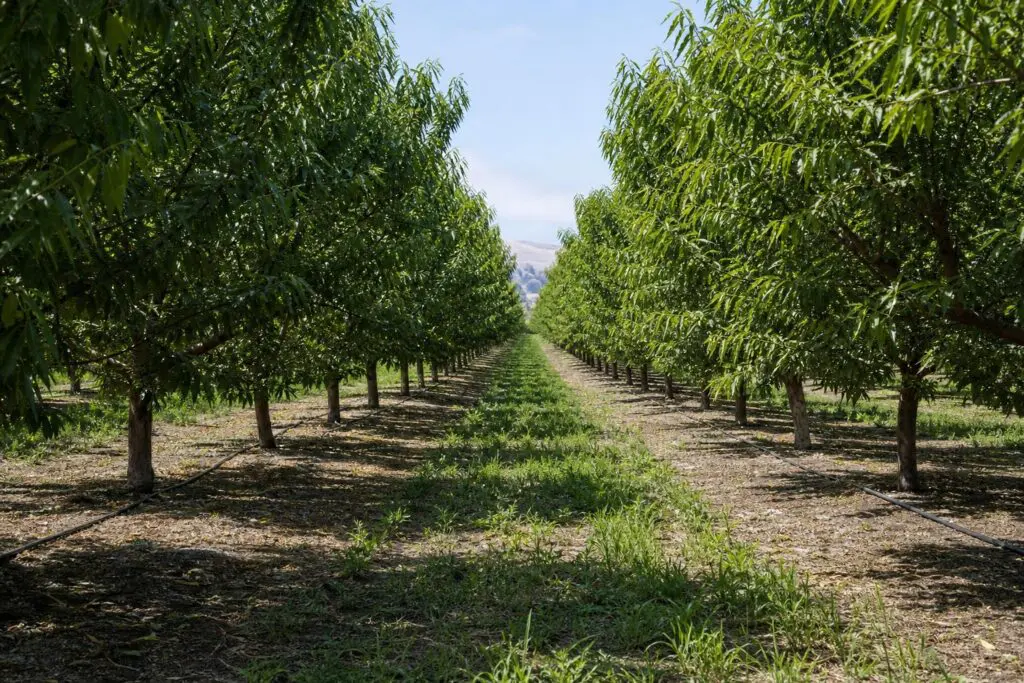
Orchard-floor management can change the comparison further. The November report assumes vegetation is managed through some combination of herbicide strips, frequent mowing or tillage, along with shading and water stress in the middle and later parts of the season. Those assumptions define the floor conditions represented by the estimates, rather than describing every orchard.
Where growers manage planted cover crops more intensively for maximum growth, weekly soil moisture loss can be as much as 25 percent higher, according to the report. That is a conditional difference, not a blanket adjustment for any orchard with vegetation. The relevant question is how closely actual floor conditions match the report’s assumptions.
Crop water use is also different from the amount irrigation must supply. UCCE’s guide says growing-season rainfall and soil moisture carried over from the dormant season can meet part of the estimated demand. Its approach compares accumulated crop water use with accumulated precipitation, then considers the difference against water held in the crop’s root zone.
Local measurements help make that comparison useful. The guide says rainfall measured on the farm or ranch improves the estimate, and it recommends confirming irrigation decisions with soil moisture monitoring or crop water status measured with a pressure chamber. These checks connect the weather-based calculation to conditions in the orchard before an irrigation decision.
Account for system performance
Irrigation efficiency adds another step between estimated use and applied water. The November report lists typical efficiency ranges of 80 to 95 percent for drip, 80 to 90 percent for micro-sprinklers, 70 to 85 percent for sprinklers and 50 to 75 percent for border-furrow systems. Those ranges are not measurements of a particular installation.
UCCE’s older guidance also emphasizes application uniformity: systems that distribute water more uniformly require less water to meet crop needs. Turning a water-depth estimate into operating hours requires knowing the system’s application rate. For drip and micro-sprinkler orchards, the guide describes estimating that rate from emitters per acre and a reliable discharge rate for each emitter.
The practical sequence is to identify what the ET figure represents, account for rainfall and stored soil water, and then consider orchard-floor conditions and system performance. Soil moisture or crop water-status measurements provide a separate field check. The report supplies an estimate for that process; the orchard’s conditions determine how it translates into an irrigation decision.