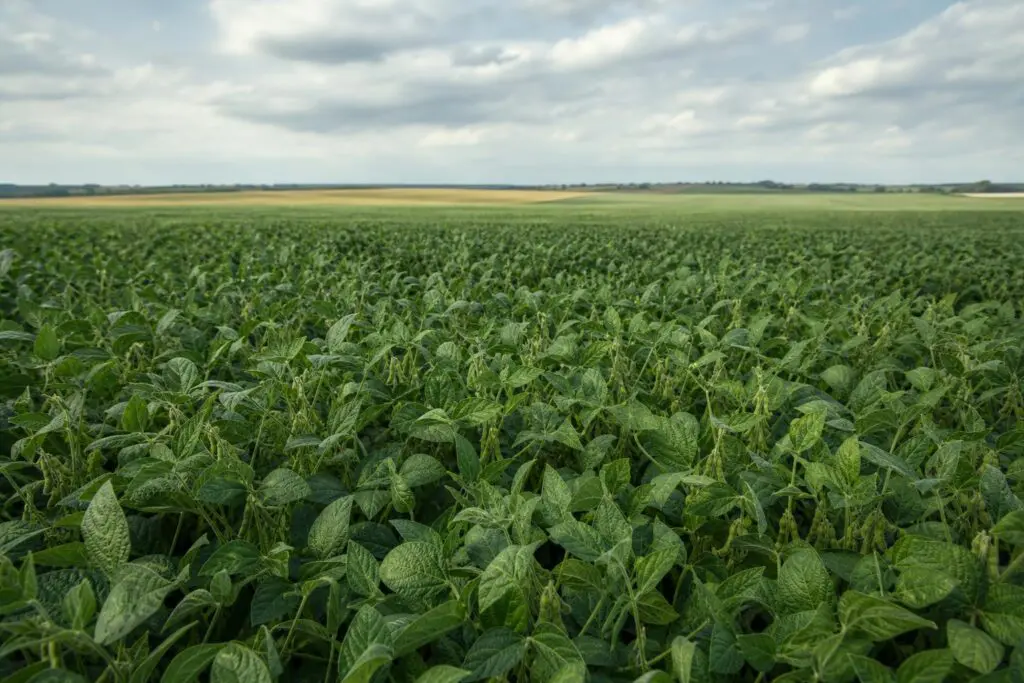
Brazilian soybean farms held a substantial cost advantage over U.S. farms in a university analysis published Nov. 2, but cheaper fertilizer and pesticides were not the reason. Across nine benchmark farms studied for 2020-2024, lower overhead, mainly land costs, more than offset Brazil’s higher spending on those inputs. The findings show why input purchases alone do not explain the competitive gap.
Julio Bellodi Cortarelli and Grant Gardner of the University of Kentucky and Joana Colussi of Purdue University compared four Brazilian farms with five U.S. farms. Average total costs were $416 per acre in Brazil and $616 in the United States. U.S. costs were higher in every year examined, although the size of the difference changed considerably.
The researchers used agri benchmark’s standardized typical-farm data, designed to represent commercial production systems rather than provide national averages. The Brazilian farms were in Mato Grosso and Paraná; the U.S. farms were in Indiana, Iowa, North Dakota and Ohio. Two farms lacked one year of data. These are historical comparisons, not estimates of 2026 production costs.
Separating overhead from crop inputs
The analysis separates expenses into three groups. Direct costs include seed, fertilizer, pesticides, crop insurance, irrigation, drying and input-financing interest. Operating costs cover machinery, labor, fuel and contractors. Overhead includes land, buildings and miscellaneous expenses. Keeping those categories separate reveals a different picture than a comparison focused only on annual input purchases.
Overhead averaged $251 per acre on the U.S. farms and $97 on the Brazilian farms. Mainly reflecting land, overhead represented about 40% of U.S. total costs, compared with 19% to 30% in Brazil. Direct costs moved in the opposite direction: Brazilian farms averaged $218 per acre, against $200 for the U.S. sample.
Higher input bills and different price peaks
Fertilizer spending averaged $85 per acre in Brazil and $57 in the United States. The researchers attribute the difference to both application amounts and prices. Brazil’s Cerrado soils require substantial fertilizer and lime, while imported nutrients must travel from ports to inland production regions. Phosphorus accounted for most of the fertilizer-spending gap in the sample.
The timing of fertilizer costs also differed. U.S. spending peaked at $78 per acre in 2022, twice its 2020 level. Brazilian spending peaked a year later at $150, nearly three times its 2020 level. The authors suggest fertilizer purchased at peak 2022 prices likely entered Brazil’s 2022/23 crop. By 2024, spending had eased in both countries.
Pesticide spending averaged $81 per acre in Brazil and $56 in the United States. The authors link Brazil’s higher expenses to greater insect and disease pressure and the cost of moving imported chemicals inland. An important sample limitation applies: the U.S. farms reported only herbicide expenses for soybeans, not fungicide or insecticide costs.
That reporting pattern does not describe all U.S. soybean production. The researchers note that nationally, roughly one-fifth of soybean acres receive a fungicide and a similar share receive an insecticide. Seed, meanwhile, cost more in the U.S. sample: $66 per acre versus $43 in Brazil. The authors associate part of that difference with more stacked traits in U.S. seed.
Brazil’s lower total costs did not insulate the sample farms from input-price shocks. In 2023, when Brazilian input expenses peaked, the total-cost difference narrowed to $71 per acre. In every other year, it exceeded $200. That variation illustrates the exposure behind the average: lower land-related costs coexisted with substantial fertilizer and pesticide bills.
Profitability depends on the sample, too
A separate analysis published Feb. 23 by Purdue’s Colussi and Michael Langemeier adds profitability context, but uses only one typical farm in Iowa and one in Mato Grosso. On that U.S. farm, total production costs rose 13% between 2020 and 2024, from $399 to $448 per ton. Operating costs increased 14% over the same period.
The Brazilian farm in the February comparison maintained positive economic profits throughout 2020-2024, although profits weakened after 2022. The Iowa farm recorded losses in 2020 and 2024. Those calculations subtract direct, operating and overhead expenses from revenue. They describe returns after all three cost categories, rather than simply the money left after purchasing crop inputs.
The two analyses share a benchmark network and a researcher, but their samples produce different cost shares. Direct expenses exceeded 60% of Brazilian costs on average in the February two-farm study, versus 47% to 57% in November’s broader comparison. For readers comparing budgets, that distinction matters: the farms selected change the proportions, even when land-related overhead remains central to explaining the gap.