
USDA’s updated Feedstock Carbon Intensity Calculator gives growers a separate score for each field or management unit, replacing the pilot’s whole-farm average. The change makes field-level yield and nitrogen records central to the calculation. But a lower score is not a payment promise: any farmer benefit still depends on demand from biofuel producers.
Version 1.2 was released September 11, according to University of Illinois authors Zhangliang Chen and Jonathan Coppess, who examined the changes in an October analysis. It is available as an Excel workbook and a browser-based tool. Their review describes how the updated calculator works, rather than announcing a new October release.
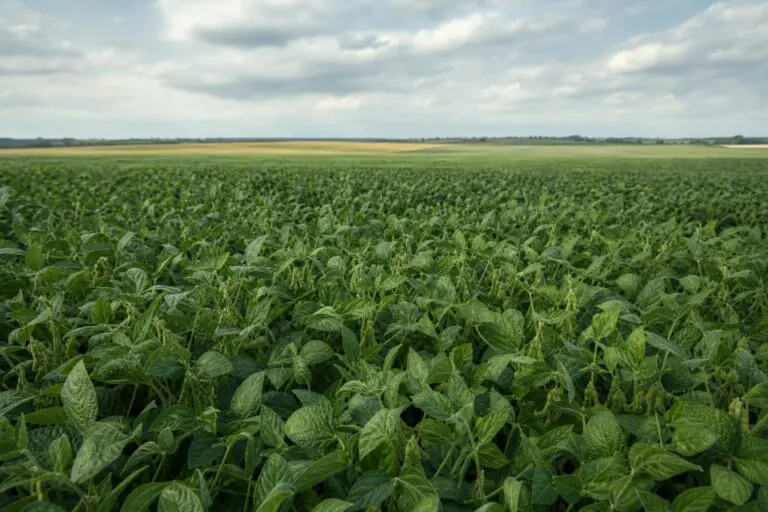
USDA says the calculator covers four domestic biofuel feedstocks: field corn, soybeans, sorghum and spring canola. It estimates greenhouse gas emissions per bushel, expressed as carbon dioxide equivalents. The calculation combines nutrient-management information with selected farming practices, including those that affect soil carbon, fertilizer-related emissions and energy use on the farm.
The field records behind the score
Each enrolled field now needs its actual yield, expected yield and total synthetic nitrogen applied per acre, Chen and Coppess explain. Expected yield is usually the field’s actual production history, or APH yield, used in federal crop insurance. The pilot instead combined fields into one farm score, weighted by the bushels each field produced.
Other entries describe location, acreage, cover crops, tillage, nitrogen inhibitors and manure applications. A management unit can include multiple fields with the same crops and management practices, according to the authors. The output reports a score for that unit and details showing how the calculator arrived at the result, rather than only a single farmwide number.
Yield affects the calculation through nitrogen use per bushel. The tool starts with actual yield but limits the yield used in its calculations to within 20% above or below expected yield. It then divides synthetic nitrogen applied by that yield. This limits how far an unusually strong or poor harvest can move the score.
Chen and Coppess explain that nitrogen per bushel adjusts three fertilizer-related emissions components: nitrogen fertilizer manufacturing and transportation, nitrous oxide from fertilizer nitrogen, and carbon dioxide released from urea. Less nitrogen per bushel than the modeled baseline lowers those components; more raises them. Entered manure nitrogen also contributes to the nitrous oxide calculation.
Regional modeling shapes results
Not every part of the score responds to a grower’s yield. Soil carbon and several other components come from regional lookup tables or national averages, the authors explain. USDA bases its regional analysis on Major Land Resource Areas, which reflect different soils and growing conditions. Those areas generally do not follow county or state boundaries.
That geographic structure matters when comparing results. USDA says the effectiveness of nutrient management and low-carbon practices varies by region. A score reflects both the information entered for a field and modeled regional effects, not simply a tally of practices. A practice therefore does not carry one uniform carbon benefit everywhere it is used.
A carbon score is not a grain premium
The financial connection runs through the biofuel producer. In their earlier explanation of the Clean Fuel Production Tax Credit, known as 45Z, Chen and Coppess describe an incentive for fuel producers to lower the carbon intensity of their finished fuel. Lower-carbon feedstocks can help, potentially making those bushels more attractive to a buyer.
Farmers do not receive the fuel producer’s tax credit directly. Any benefit reaches them indirectly through the market for feedstocks, the authors explain. A calculator result therefore measures estimated emissions, not a grain premium. It does not, by itself, establish what a buyer will pay for a particular field’s production.
Documentation is part of the process. Chen and Coppess report that producers must retain calculator inputs and outputs, plus records showing how practices were carried out, for five years; accredited third-party verifiers can audit them. USDA also cautions that its calculator is distinct from other incentive methodologies: its values do not necessarily transfer to other programs, and its guidelines are not a carbon-offset protocol.